Charts
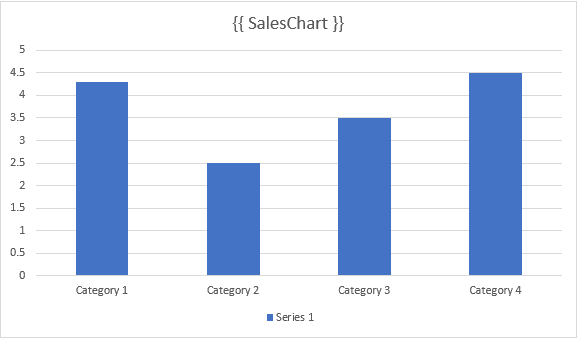
Generate dynamic charts in your documents by adding a placeholder chart to your template and placing a tag in its title. When the document is generated, the placeholder chart is populated with the input data you provide.
The placeholder chart determines the chart type and visual style, while the input data you provide determines its content.
Simple Example
Lets see how to use the chart syntax to create a simple sales performance report:
- Add a placeholder chart to the template.
- Place a tag in the chart's title.
In this example we've added the {{ SalesChart }} tag in the placeholder chart's title:
Sales Performance Report
This report provides an overview of our monthly sales performance across all product categories.
The chart below shows our sales trends over the past 6 months. As we can see, there has been consistent growth in our overall revenue.
We've set the chart input data for this example to:
The resulting document contains the populated "Sales Overview" chart:
Sales Performance Report
This report provides an overview of our monthly sales performance across all product categories.
The chart below shows our sales trends over the past 6 months. As we can see, there has been consistent growth in our overall revenue.
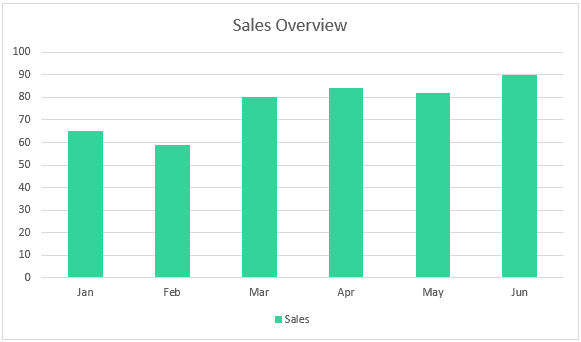
Chart Properties
Chart data format varies depending on the chart type. The common properties are:
| Property | Type | Description |
|---|---|---|
_type | string | Must be set to "chart" for all chart types |
title | string | Optional. The title to use instead of the tag name. If not provided the tag will be replaced with an empty string. |
Chart Styling
Charts preserve their original styling and settings from the placeholder chart in your template, including:
- Font styles and sizes
- Axis formatting
- Grid lines
- Legend position and style
- Chart dimensions and layout
You can customize the following through the input JSON data:
- Chart title
- Series colors (using hex color codes)
- Series names for the legend
- Data values and labels
The input data doesn't need to match the placeholder chart. Your generated chart can have more or fewer series, data points, bars, or slices than the original. TemplateDocs automatically adjusts the chart to match the data you provide.
The chart's visual style (fonts, grid, dimensions, etc.) is determined by the placeholder chart in your template. Remember to set up the placeholder with your desired styling before generating documents.
Chart Types
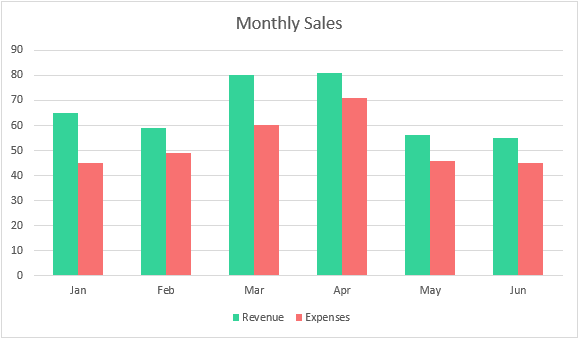
Bar Chart
Example
Bar Chart Properties
| Property | Type | Description |
|---|---|---|
_type | string | Must be set to "chart" |
title | string | Optional. The title to use instead of the tag name |
categories | string[] | Array of labels for the x-axis |
series | object[] | Array of data series objects |
series[].name | string | Optional. Legend label for the series |
series[].color | string | Optional. Hex color code for the bars |
series[].values | number[] | Array of numeric values matching categories |
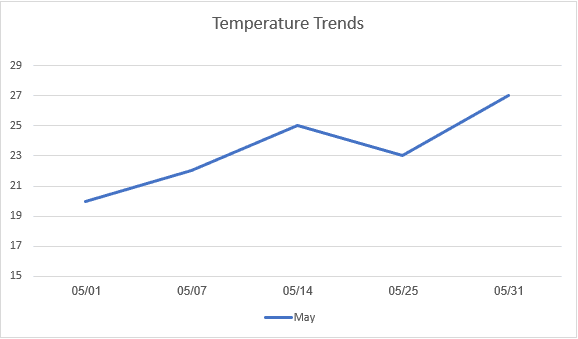
Line Chart
Example
Line Chart Properties
| Property | Type | Description |
|---|---|---|
_type | string | Must be set to "chart" |
title | string | Optional. The title to use instead of the tag name |
categories | string[] | Array of labels for the x-axis |
series | object[] | Array of data series objects |
series[].name | string | Optional. Legend label for the series |
series[].color | string | Optional. Hex color code for the bars |
series[].values | number[] | Array of numeric values matching categories |
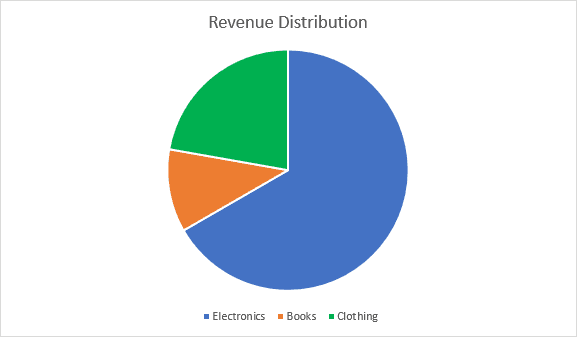
Pie Chart
Both pie and doughnut charts are supported. They have the same properties.
Example
Pie Chart Properties
| Property | Type | Description |
|---|---|---|
_type | string | Must be set to "chart" |
title | string | Optional. The title to use instead of the tag name |
series | object[] | Array of value objects |
series[].name | string | Optional. Label for the value |
series[].value | number | Numeric value |
Notice that pie and doughnut charts have a single series
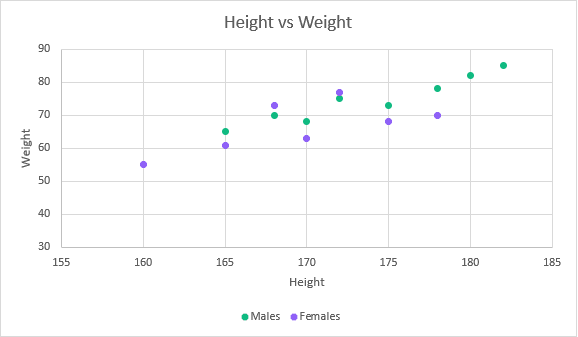
Scatter Chart
Example
Scatter Chart Properties
| Property | Type | Description |
|---|---|---|
_type | string | Must be set to "chart" |
title | string | Optional. The title to use instead of the tag name |
series | object[] | Array of data series objects |
series[].name | string | Optional. Legend label for the series |
series[].color | string | Optional. Hex color code for the series |
series[].values | object[] | Array of value objects |
series[].values[].x | number | X-axis value |
series[].values[].y | number | Y-axis value |
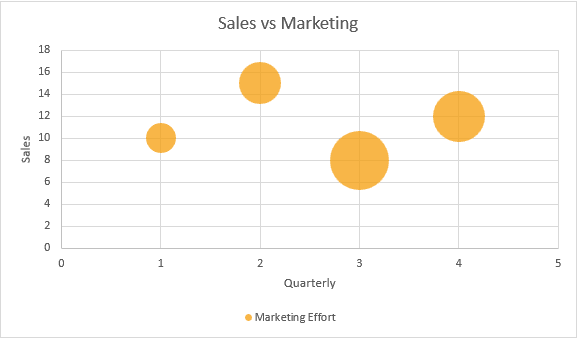
Bubble Chart
Example
Bubble Chart Properties
| Property | Type | Description |
|---|---|---|
_type | string | Must be set to "chart" |
title | string | Optional. The title to use instead of the tag name |
series | object[] | Array of data series objects |
series[].name | string | Optional. Legend label for the series |
series[].color | string | Optional. Hex color code for the series |
series[].values | object[] | Array of value objects |
series[].values[].x | number | X-axis value |
series[].values[].y | number | Y-axis value |
series[].values[].size | number | Size of the bubble |
